
 By
By Given the daily bombardment of often conflicting headlines, whether via rustling broadsheet or the ping of a mobile notification, you’d be forgiven for being confused about the state of the property market – we hear on one day that we’re on the brink of a property market ‘crash’ (a popular tabloid) and on another that prices have had the biggest monthly rise for a year (a certain public broadcaster).
Now while its certainly a challenging market for movers (more on that shortly), there is usually more to the story than those clickbait headlines, especially when you go beyond the national averages and dig into the local picture in more detail. So let’s cut through the hype and get into some analysis of both the national and local markets, from an on-the-ground perspective.
Base rates held at 5.25% - the end of rate rises?
The Bank of England (BoE) issued a rather sombre announcement following their latest meeting on 2nd November stating that the base rate would be held at 5.25%. While good news that rates weren’t increased again, the announcement was paired with a downgraded prediction of economic growth, implying that future rate increases may be needed to control inflation and signalled that we should not expect a rapid return to the lower rates that we have been used to in recent years. Admittedly not a particularly rosy picture for borrowers, and the continued high rates are clearly impacting buyer demand, which nationally is 9% lower than the more normal 2019 market, according to the Q3 2023 Property and Homemover Report from analytics firm TwentyCI.
What has been the impact on house prices?
When discussing house prices, it’s crucial to understand what kind of prices are being referred to, as the various published indices rely on different source data which may or may not be up to date or relevant to you. These different sources of data are often the root of much of the apparently conflicting and therefore confusing headlines published daily.
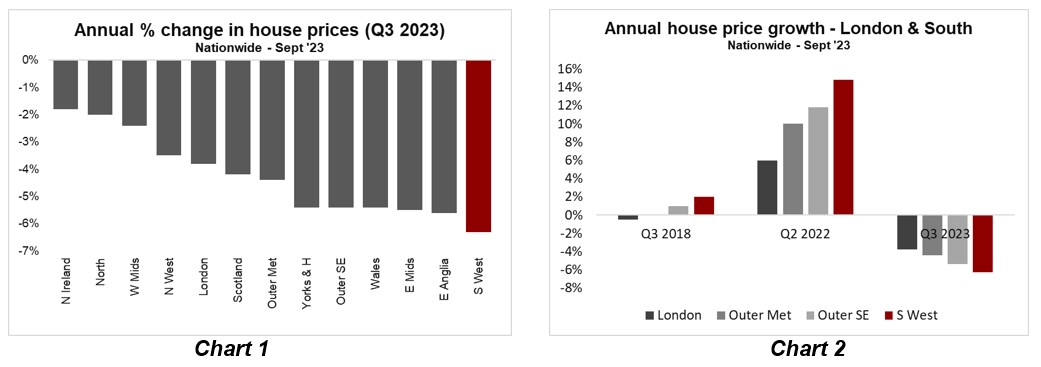
For example, Nationwide and Halifax’s house price data is based on mortgage valuations at the point when those properties approach exchange of contracts, meaning not only that they are based on sales agreed usually a few months prior, but also do not factor in transactions involving cash buyers. In September 2023, Nationwide reported in their September index that prices in the South West had experienced the biggest drop nationally, at -6.3% vs. the prior year (Chart 1), however, this is on the back of our region having the largest increase in prices during the pandemic, when compared with London and the South, associated with the ‘race for space’ (Chart 2). Post-pandemic, the South West does not have the same large city / large employer concentrations as other regions, so has not been able to sustain those artificially inflated prices.
Worth noting however is that the South West also has the highest proportion of cash buyers nationally at 44% vs. the national average of 36%, as reported by On The Market in their November 2023 Property Sentiment Index, and therefore the full market picture (including cash & mortgage purchases) will be more positive than reflected in either the Nationwide or Halifax mortgage-tied indices. Also worth bearing in mind is that mortgage-based valuations are generally the more conservative of those available, given the financial risk being undertaken by the mortgage company in loaning on a home.
Other often-quoted sources of house price data are those from the online portals of Rightmove & Zoopla, which are either solely or mainly based on property asking prices. While much more up to date, these figures may end up being negotiated down prior to the transaction completing, so aren’t an accurate reflection of what buyers are actually paying. In their latest House Price Index, Rightmove reported that prices have dropped by 1.3% nationally compared with a year ago and that here in the South West, we have experienced a larger decrease in prices of 2.5% over the same period. While price decreases were initially focused in a few areas of the country which had become over inflated during the pandemic race for space (including our local Okehampton and Tavistock markets), the price transition is now affecting the majority of the country, with Zoopla observing in October that 80% of markets are now experiencing year-on-year price declines, vs. only 5% of the country as little as 6 months ago.
The final primary source of house price data quoted by the media, and frankly the only ‘true’ measure of house prices is the Land Registry, which tracks sold prices as recorded after a transaction completes. So why do we not only use this data source? The issue is that the data is only released a few months after the transaction completes, which in turn is usually a further few months after the sale price was agreed, meaning that the reported prices are generally about 6+ months out of date. So while this dataset is therefore the best source for any retrospective analysis of house prices, it is not really that useful as a measure of what’s going on in the market this red hot minute. For a hindsight view, data from Land Registry regarding completions in September 2023 (and so agreed prices from approximately March 2023), showed that sold prices across West Devon in September 2023 fell by 7.8% year-on-year, and decreased 1.8% compared to the previous month. The average price for a detached property was £446,787.
So if reported prices don’t tell the full story, what other measures are there of the property market health?
Other key metrics used to assess the state of the property market look at activity levels. Both Zoopla & Rightmove are seeing significantly lower transaction levels nationally than last year, forecasting decreases of 23% and 17% less home moves respectively and in addition, Zoopla reports that the number of homes for sale nationwide is at a 6-year high. More homes on the market and less being sold mean that the market is even more strongly favouring buyers (which exacerbates the trend of decreasing prices).
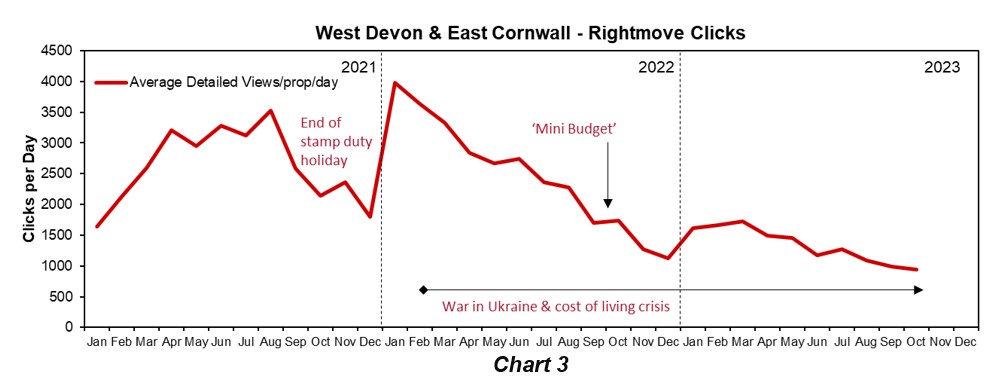
In our local West Devon & East Cornwall market, we are seeing lower buyer demand and more houses on the market as illustrated in the charts below. Chart 3 below illustrates buyer demand in our area as measured by views on Rightmove of all property on the market – it is clear that appetite for South West homes has decreased dramatically since the pandemic-triggered high in January 2022, and demand has dropped 46% since this time last year.
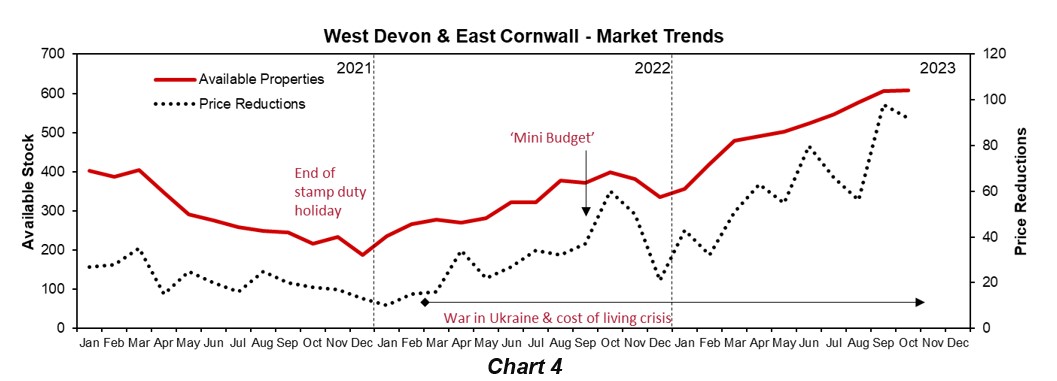
In addition, Chart 4 below shows how the number of properties on the market has increased steadily, while the number of price reductions required to achieve a sale has also increased, as sellers accept that a lower price is needed to find a buyer, given the imbalance in supply and demand. However the approach of pricing higher at the outset ‘just to see’, and reducing later “seriously damages chances of a sale” according Rightmove analysis. “Accurately priced properties succeed in finding a buyer in less than half the time that it takes those that need a reduction……and the sale is 50% less likely to fall through” says Tim Bannister of Rightmove.
Enough statistics - when can I expect prices to start climbing again?
While sobering, it is important to keep the statistics quoted above in perspective - the house price falls we have seen have been modest compared to the 20% reduction in buying power imposed by higher mortgage rates and cost of living pressures. Low unemployment and (gradually) increasing incomes, as well as stringent stress-tests by lenders prior to mortgage approval mean that it is unlikely that we are going to see a glut of forced sales or repossessions and a corresponding ‘crash’ in prices.
The majority of analysts agree that while prices will likely remain low nationally through 2024 constrained by stubbornly high mortgage rates (at least compared with recent years), we should see rates drop and prices turn back towards growth in 2025. We are hopeful that we’ll see some green shoots here in the South West a little earlier still, given that we’re somewhat further through the transition than other parts of the country.
It is also key to note that there are still buyers in the market and sales being agreed – the buyers that are looking right now are more committed and have usually already taken a hard look at their finances before starting the process of house hunting. In fact, the number of sales agreed in West Devon & East Cornwall in September was almost identical to the number agreed a year prior – there are deals to be made, as long as sellers in the South West remember that they *really* have to Price to Entice (get the price right first time) and Dress to Impress (make sure your property stands out from the crowd via styling and fantastic photography).
As always, if you would like to dig deeper into any of the topics mentioned above, or if you’d like an analysis of how your property value might sit within our local market (minus the hype), we’d love to hear from you – please do give us a call on 01837 54080 or 01822 617243.
PS: And as for when the market will hit bottom…..well, the only way to know we’ve found the bottom is when prices start rising again, by which point you may have missed the opportunity for a strategic upsize or a great value local move. So the best approach is always to do what’s right for you and your situation, rather than what the media speculates the market might or might not do.

 by
by 
 by
by 

Share this with
Email
Facebook
Messenger
Twitter
Pinterest
LinkedIn
Copy this link